The question I hear most often in SEO conversations is: “When will I see results?”
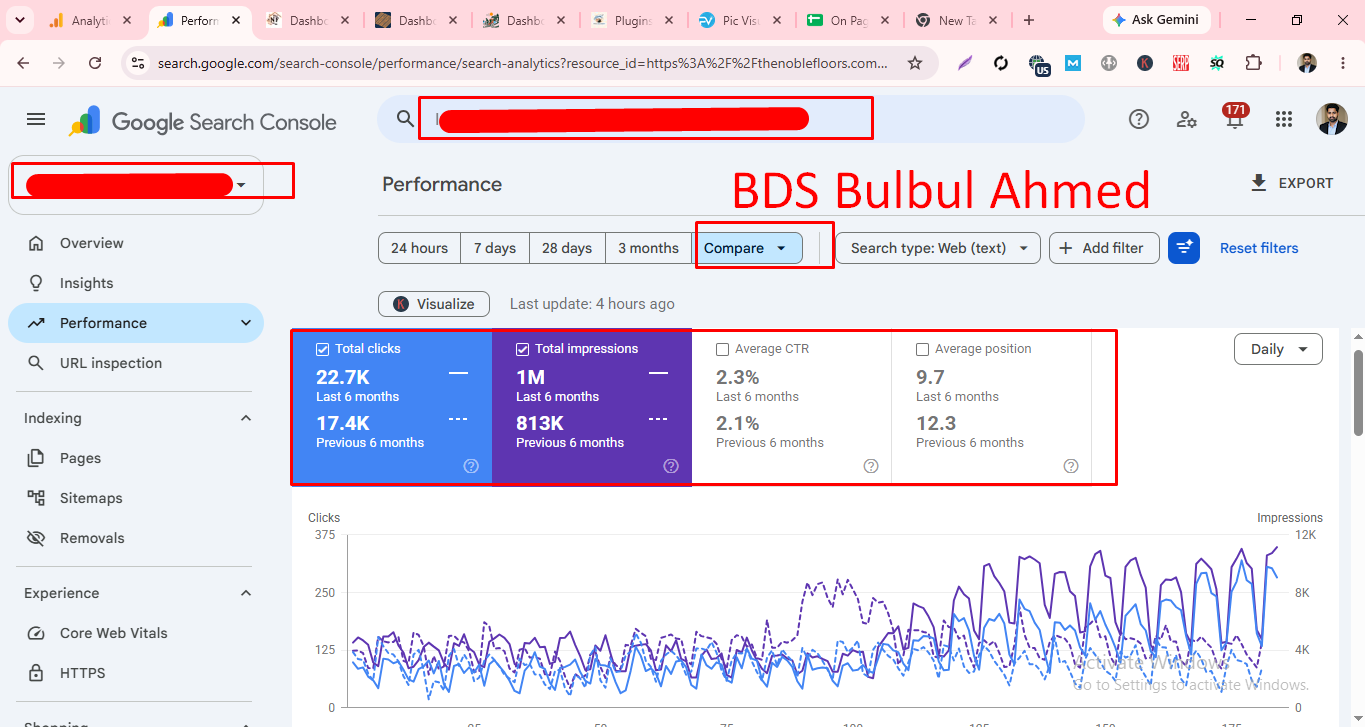
The most honest answer is a real graph. In today’s case study, I’m analyzing 6 months of Google Search Console performance data. There are no estimates here. Every number comes directly from Search Console.
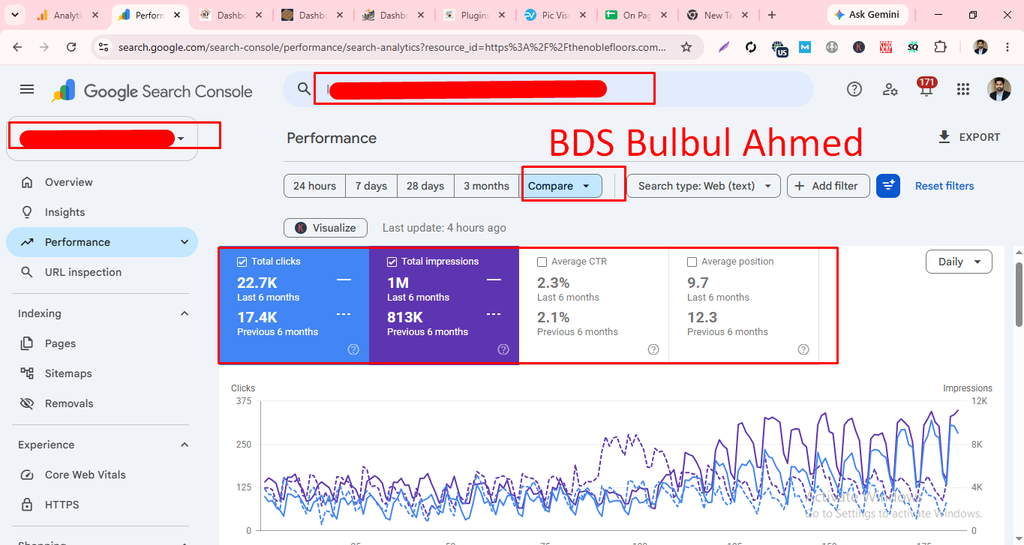
6-Month Results at a Glance
| Metric | Result |
|---|---|
| Total Clicks | 22.7K |
| Total Impressions | 1M |
| Average CTR | 2.3% |
| Average Position | 9.7 |
Viewed in isolation, these four numbers leave the story incomplete. Let’s analyze them together.
What the Graph Shows: Two Distinct Phases
The performance graph splits clearly into two phases.
Phase 1 (May to mid-August): building the foundation.
During this period, daily clicks stayed fairly flat at around 100. From the outside it may look like nothing is happening. But in SEO, this phase matters most, because this is where keyword structure, content, technical foundations, and Google’s trust are built.
Phase 2 (late August to November): the growth phase.
From late August, both clicks and impressions rose visibly. From September to November, daily clicks reached roughly 250-300 or higher, about two and a half to three times the first phase.
Takeaway: SEO doesn’t grow in a straight line. It’s slow at first, then picks up speed suddenly. Those who lose patience in the first 2-3 months often stop before they reach this second phase.
A Deeper Look at the Four Metrics
1. 22.7K Clicks: Free, High-Intent Traffic
Over 6 months, roughly 125 people per day came to the site from Google Search on average. What makes organic clicks special is that these people were searching for something themselves. No ad interrupted them. The site appeared as an answer to their search, so conversion potential is usually higher.
2. 1M Impressions: Invisible Brand Advertising
Impressions count how many times the site appeared in search results. Not all of those million impressions turned into clicks, but each one showed the brand name and title to a searcher. Buying that kind of exposure through ads would take a significant budget.
3. 2.3% CTR: Where the Biggest Opportunity Hides
22.7K clicks on 1M impressions gives a CTR of about 2.3%. One important point: this is the average across all keywords. Keywords where the site ranks in the top 3 have a much higher CTR than this average, while those lower on the page have a much lower one. So there are two ways to raise CTR:
- Make titles and meta descriptions more compelling
- Move priority keywords into the top 3 positions
4. Average Position 9.7: On the Edge of Page One
A position of 9.7 means the site sits near the bottom of Google’s first page on average. (The smaller the position number, the better the ranking.) That’s good news because it’s on page one. It also signals opportunity, because moving up to the top 5 or top 3 can lift clicks significantly.
Keep in mind: Average position is a blended number across all keywords. Some keywords may rank first while others sit on page two. That’s why keyword-level analysis matters more than judging by the average alone.
Our SEO Framework
We follow four phases on every project:
| Phase | Work |
|---|---|
| Discovery | Analyzing business goals, competitors, and the market |
| Strategize | Keyword research and a data-backed roadmap |
| Implementation | On-page, technical SEO, and content execution |
| Analysis & Optimization | Continuous improvement from Search Console data |
What Comes Next?
Building on these results, the next focus areas are:
- Moving keywords currently at positions 4-10 into the top 3
- Testing and improving titles and meta descriptions on low-CTR pages
- Building topical authority with new content around successful pages
- Strengthening internal linking
Frequently Asked Questions (FAQ)
How long does SEO take to show results?
It depends on the website, the competition, and the quality of the work. In this case study, growth became clear from late August after a slower first few months.
What’s the difference between impressions and clicks?
Impressions count how many times your site appeared in Google results. Clicks count how many people clicked through to the site.
What is CTR?
CTR (Click-Through Rate) is the percentage of impressions that turned into clicks. Formula: clicks ÷ impressions × 100.
Is a lower or higher average position better?
Lower is better. Position 1 means the very top of Google.
Want an SEO Roadmap for Your Business?
At BDS Digital Marketing, a team of 30+ specialists serves businesses in Bangladesh and the USA with SEO, PPC, email marketing, social media, and web design. You can follow campaign progress yourself through a real-time dashboard.
We’re ready to analyze your website’s current position and build an effective plan for you.
WhatsApp: +8801829349380